

PHP Highcharts Column Chart Example
Hi Dev,
In this blog,I will learn you how to implement simple dynamic column highcharts utilizing php mysql database.We will show example of php highcharts column chart.Highcharts is a one type js library, that provide to populate bar chart, line chart, area chart, column chart etc. Highcharts library additionally provide several theme and graphic design that way you can make better layout. Highcharts is a very popular and simple library for php developer.
Here, I will give you full example for simply exhibit highcharts column chart utilizing php as bellow.
Step 1: Create DatabaseIn first step we require to create new database "phpexample", Or you can rename as you like. After creating successfully database, In this example we will show compare column chart of viewer and clicks, So we require to create tables. we require following two tables.
1)test_viewer
2)test_click
In this step two table by following mysql query as like bellow example.
Create test_viewer tableCREATE TABLE IF NOT EXISTS `test_viewer` ( `id` int(11) NOT NULL AUTO_INCREMENT, `numberofview` int(11) NOT NULL, `created_at` timestamp NOT NULL DEFAULT CURRENT_TIMESTAMP, PRIMARY KEY (`id`) ) ENGINE=InnoDB DEFAULT CHARSET=latin1 AUTO_INCREMENT=10 ;Create test_click table:
CREATE TABLE IF NOT EXISTS `test_click` (
  `id` int(11) NOT NULL AUTO_INCREMENT,
  `numberofclick` int(12) NOT NULL,
  `created_at` timestamp NOT NULL DEFAULT CURRENT_TIMESTAMP,
  PRIMARY KEY (`id`)
) ENGINE=InnoDB  DEFAULT CHARSET=latin1 AUTO_INCREMENT=10 ;
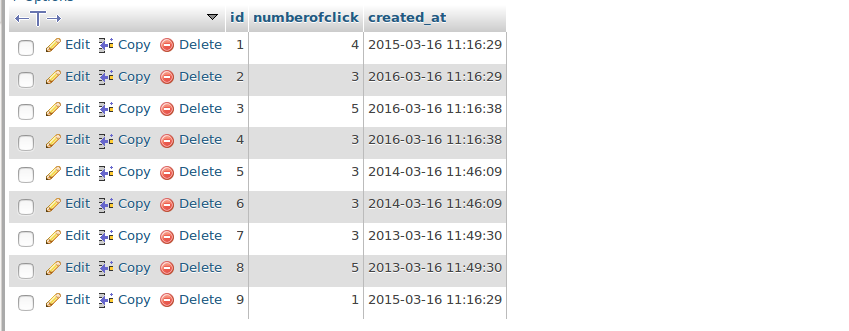
Now we require to some dummy data with different year, So you can add like added bellow screen shot, I added both tables with some dummy records that way you can simply add in yout database for testing.
test_viewer table
Now this step, I need to create on mysql database configuration file. In this file we will add details of phpmyadmin username, password and database name, So let's create new file "db_config.php" and put bellow code.
<?php
    $dbHost = "localhost";
    $dbDatabase = "phpexample";
    $dbUser = "root";
    $dbPasswrod = "root";

    $mysqli = mysqli_connect($dbHost, $dbUser, $dbPasswrod, $dbDatabase);
?>
Step 3: Create index.php File
Here this last step, we have to just create index.php file in root folder. In this file i write code of getting data from mysql database and convert into json data. So let's create new file "index.php" and put bellow code.
<?php
    require('db_config.php');

    /* Getting test_viewer table data */
    $sql = "SELECT SUM(numberofview) as count FROM test_viewer
            GROUP BY YEAR(created_at) ORDER BY created_at";
    $viewer = mysqli_query($mysqli,$sql);
    $viewer = mysqli_fetch_all($viewer,MYSQLI_ASSOC);
    $viewer = json_encode(array_column($viewer, 'count'),JSON_NUMERIC_CHECK);

    /* Getting test_click table data */
    $sql = "SELECT SUM(numberofclick) as count FROM test_click
            GROUP BY YEAR(created_at) ORDER BY created_at";
    $click = mysqli_query($mysqli,$sql);
    $click = mysqli_fetch_all($click,MYSQLI_ASSOC);
    $click = json_encode(array_column($click, 'count'),JSON_NUMERIC_CHECK);

?>
<!DOCTYPE html>
<html>
<head>
    <title>HighChart</title>
    <link rel="stylesheet" href="https://maxcdn.bootstrapcdn.com/bootstrap/3.3.7/css/bootstrap.min.css">
    <script type="text/javascript" src="https://cdnjs.cloudflare.com/ajax/libs/jquery/3.1.1/jquery.js"></script>
    <script src="https://code.highcharts.com/highcharts.js"></script>
</head>
<body>
<script type="text/javascript">
$(function () {
    var data_click = <?php echo $click; ?>;
    var data_viewer = <?php echo $viewer; ?>;
    $('#container').highcharts({
        chart: {
            type: 'column'
        },
        title: {
            text: 'Yearly Website Ratio'
        },
        xAxis: {
            categories: ['2013','2014','2015', '2016']
        },
        yAxis: {
            title: {
                text: 'Rate'
            }
        },
        series: [{
            name: 'Click',
            data: data_click
        }, {
            name: 'View',
            data: data_viewer
        }]
    });
});
</script>
<div class="container">
    <br/>
    <h2 class="text-center">Highcharts php mysql json example</h2>
    <div class="row">
        <div class="col-md-10 col-md-offset-1">
            <div class="panel panel-default">
                <div class="panel-heading">Dashboard</div>
                <div class="panel-body">
                    <div id="container"></div>
                </div>
            </div>
        </div>
    </div>
</div>
</body>
</html>
now we are ready to run this example, so just run bellow command on root folder for run your project.
php -S localhost:8000Now you can open bellow url on your browser:
http://localhost:8000
It will help you....
No comments:
Post a Comment